Salesforce Rebounded To Its 200-Day Simple Moving Average And Has A Positive Weekly Chart


(Photo by Stephen Lam)
Getty Images
Salesforce (CRM) traded as high as $311.75 back on November 9, 2021, and then declined by 59.47% to as low as $126.34 on December 22, 2022. The cloud-based customer relationship software company has been below a death cross formation since January 28, 2022. The stock traded as high as $161.59 this morning versus its 200-week simple moving average, or ‘reversion to the mean’ at $161.35.
Salesforce focuses on artificial intelligence software on cloud, mobile, and social platforms. The stock is not cheap. Its p/e ratio is elevated at 79.61% and it does not offer a dividend, according to Macrotrends.
The company has beaten earnings-per-share estimates in twenty-three consecutive quarters.
The Daily Chart for Salesforce
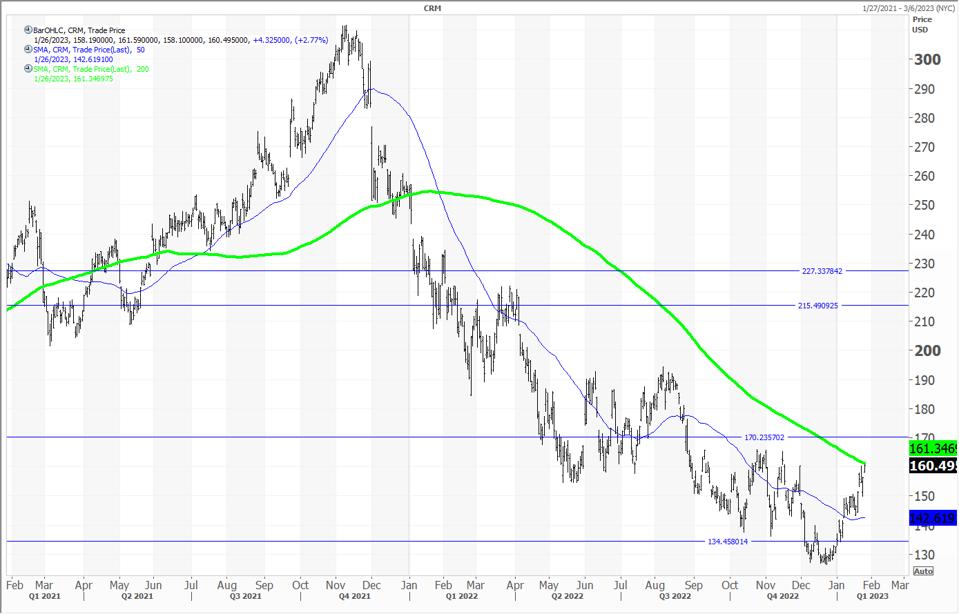
Dialy Chart for Salesforce
Courtesy of Refinitiv Xenith.
The two-year daily chart for Salesforce shows the huge downtrend from $311.75 on November 9, 2021, to the low of $126.34 set on December 22, 2022. The rebound to the 200-day simple moving average at $161.35 was a bull market gain of 27.7%.
The horizontal line at $134.57 on the chart is the monthly pivot for January. This level held as the year began and the rebound tested its 200-day simple moving average in green at $161.35 today.
Note the death cross that occurred on January 28, 2022. This tracked the downside to the December 22 low. If there is a price gap above the 200-day SMA, the first upside is too the quarterly risky level at $170.33 which is the second from the bottom horizontal line. A death cross occurs when the 50-day simple moving average in blue moves below the 200-day SMA in green.
The higher two horizontal lines are the semiannual and annual risky levels at $215.46 and $227.48, respectively.
The Weekly Chart for Salesforce
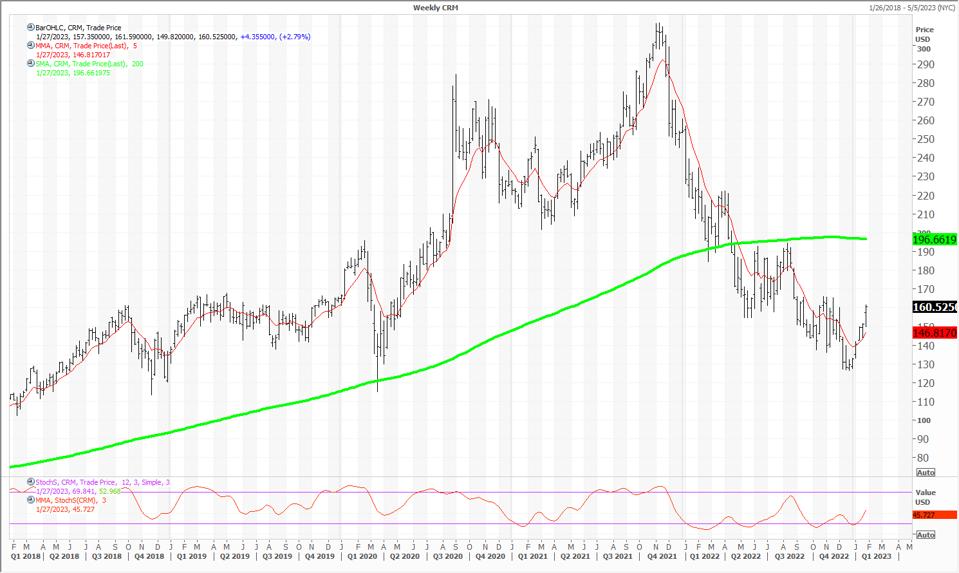
Weekly Chart for Salesforce
Courtesy of Refinitiv Xenith.
The weekly chart for Salesforce has been positive since the week of January 13. The stock is above its five-week modified moving average at $146.85 but is below its 200-week simple moving average or “reversion to the mean” at $196.6. The 12x3x3 weekly slow stochastic reading is rising at 45.76 on a scale of 00.00 to 100.00. A reading above 80.00 is overbought and a reading below 20.00 is oversold.
Trading Strategy: Buy Salesforce on weakness to its five-week modified moving average at $147.04. Reduce holdings on strength to its 200-week simple moving average at $196.67.